What Are Good Google Ads Benchmarks In 2025? [STUDY]

t2van

Senior Member
Founding Member
Bronze Star Bronze Star Bronze Star Bronze Star
Joined
Apr 22, 2025
Messages
1,764
Reaction Score
4,619
Feedback
0 / 0 / 0

What Are Good Google Ads Benchmarks In 2025? [STUDY]​

Compare your Google & Microsoft Ads performance to industry benchmarks in this updated 2025 benchmark report from Wordstream by LocaliQ.


Taken from the article:

Average Click-Through Rate In Google & Microsoft Ads By Industry​

The average click-through rate for Google & Microsoft Ads across all industries averaged out to 6.66% over the last 12 months.

1_click_through_rate_corrected-986.png


Average Cost-Per-Click In Google & Microsoft Ads By Industry​

The average cost-per-click for Google and Microsoft Ads across all industries over the past 12 months averaged $5.26.

2_cost_per_click_corrected-445.png


Average Conversion Rates In Google & Microsoft Ads By Industry​

The average conversion rate across all industries for Google and Microsoft Ads in the last twelve months was 7.52%.


3_conversion_rate_corrected-442.png
 
It's the same shitshow Larry Kim pulls every year with out of context data..

What the hell does average CTR mean? Is it for first position, 8th position? Does it take the new built in double serving into account?

By average conversion rate, do they track leads, qualified leads, calls? A call extension, message extension, sitelinks?

Same for avg CPC, what's the bidding strategy that's been used, average daily budgets..? It all connects.

You can't just look at broad averages - it makes 0 sense.
Well, I'm never sure how they get that information but the average would just be that, regardless of position id imagine it's the meanaverage an add is clicked? At least that's how I've always taken it.

If it was going to be based off position,n there would be a chart for that id imagine.

The conversion rate is a tough one, as I'm guessing it's just based off a global goal assigned vs shopping because of the type of ads they compare and industry.


The broad does kind of make sense I think. The % of data would be different if it were broken down into more specific categories, as you wanted it would also make it hard to compare in a broad term as no two industries or sectors would be the same. Not to mention the sample pool of sites required would be massive and I doubt any sole person has access to that data besides the actual ad hosts themselves (MS & Google) and I seriously doubt they would share, exact information because then people would spend less money on that type of ad for Y purpose.

Like the conversion example would be a +1 for any time the lead goal is achieved. Regardless of what that is.

However, I do agree if you took, at Animals as a conversion at 13.07% the mix on how that is defined would be different, say if more people are leaving an email vs buying, then the data is skewed a little based on whatever the goals are. So taken it on face value can be a little misleading if you think 13.07% of ads clicked will results in a sale. When say 10% of that could actually be for form filling..
I didn't mean they should answer my questions or that their yearly report should cover them, this is just a part of their sales pitch and branding.

My point was that these benchmarks don't mean anything, there's no data you can use.

It's just tons of noise, like 2014 infographic with out of context snippets of data you can't use or rely on.
Yeah most of these kinds of things won't give data you can use.

Kind of gives the game away then?


It does give overall generic information/benchmarks tho, no?

It's never going to be the exact information into any metric or insight. I don't think anyone will give that away?
 
Yeah most of these kinds of things won't give data you can use.

Kind of gives the game away then?


It does give overall generic information/benchmarks tho, no?

It's never going to be the exact information into any metric or insight. I don't think anyone will give that away?
It provides nothing in my opinion for these reasons:

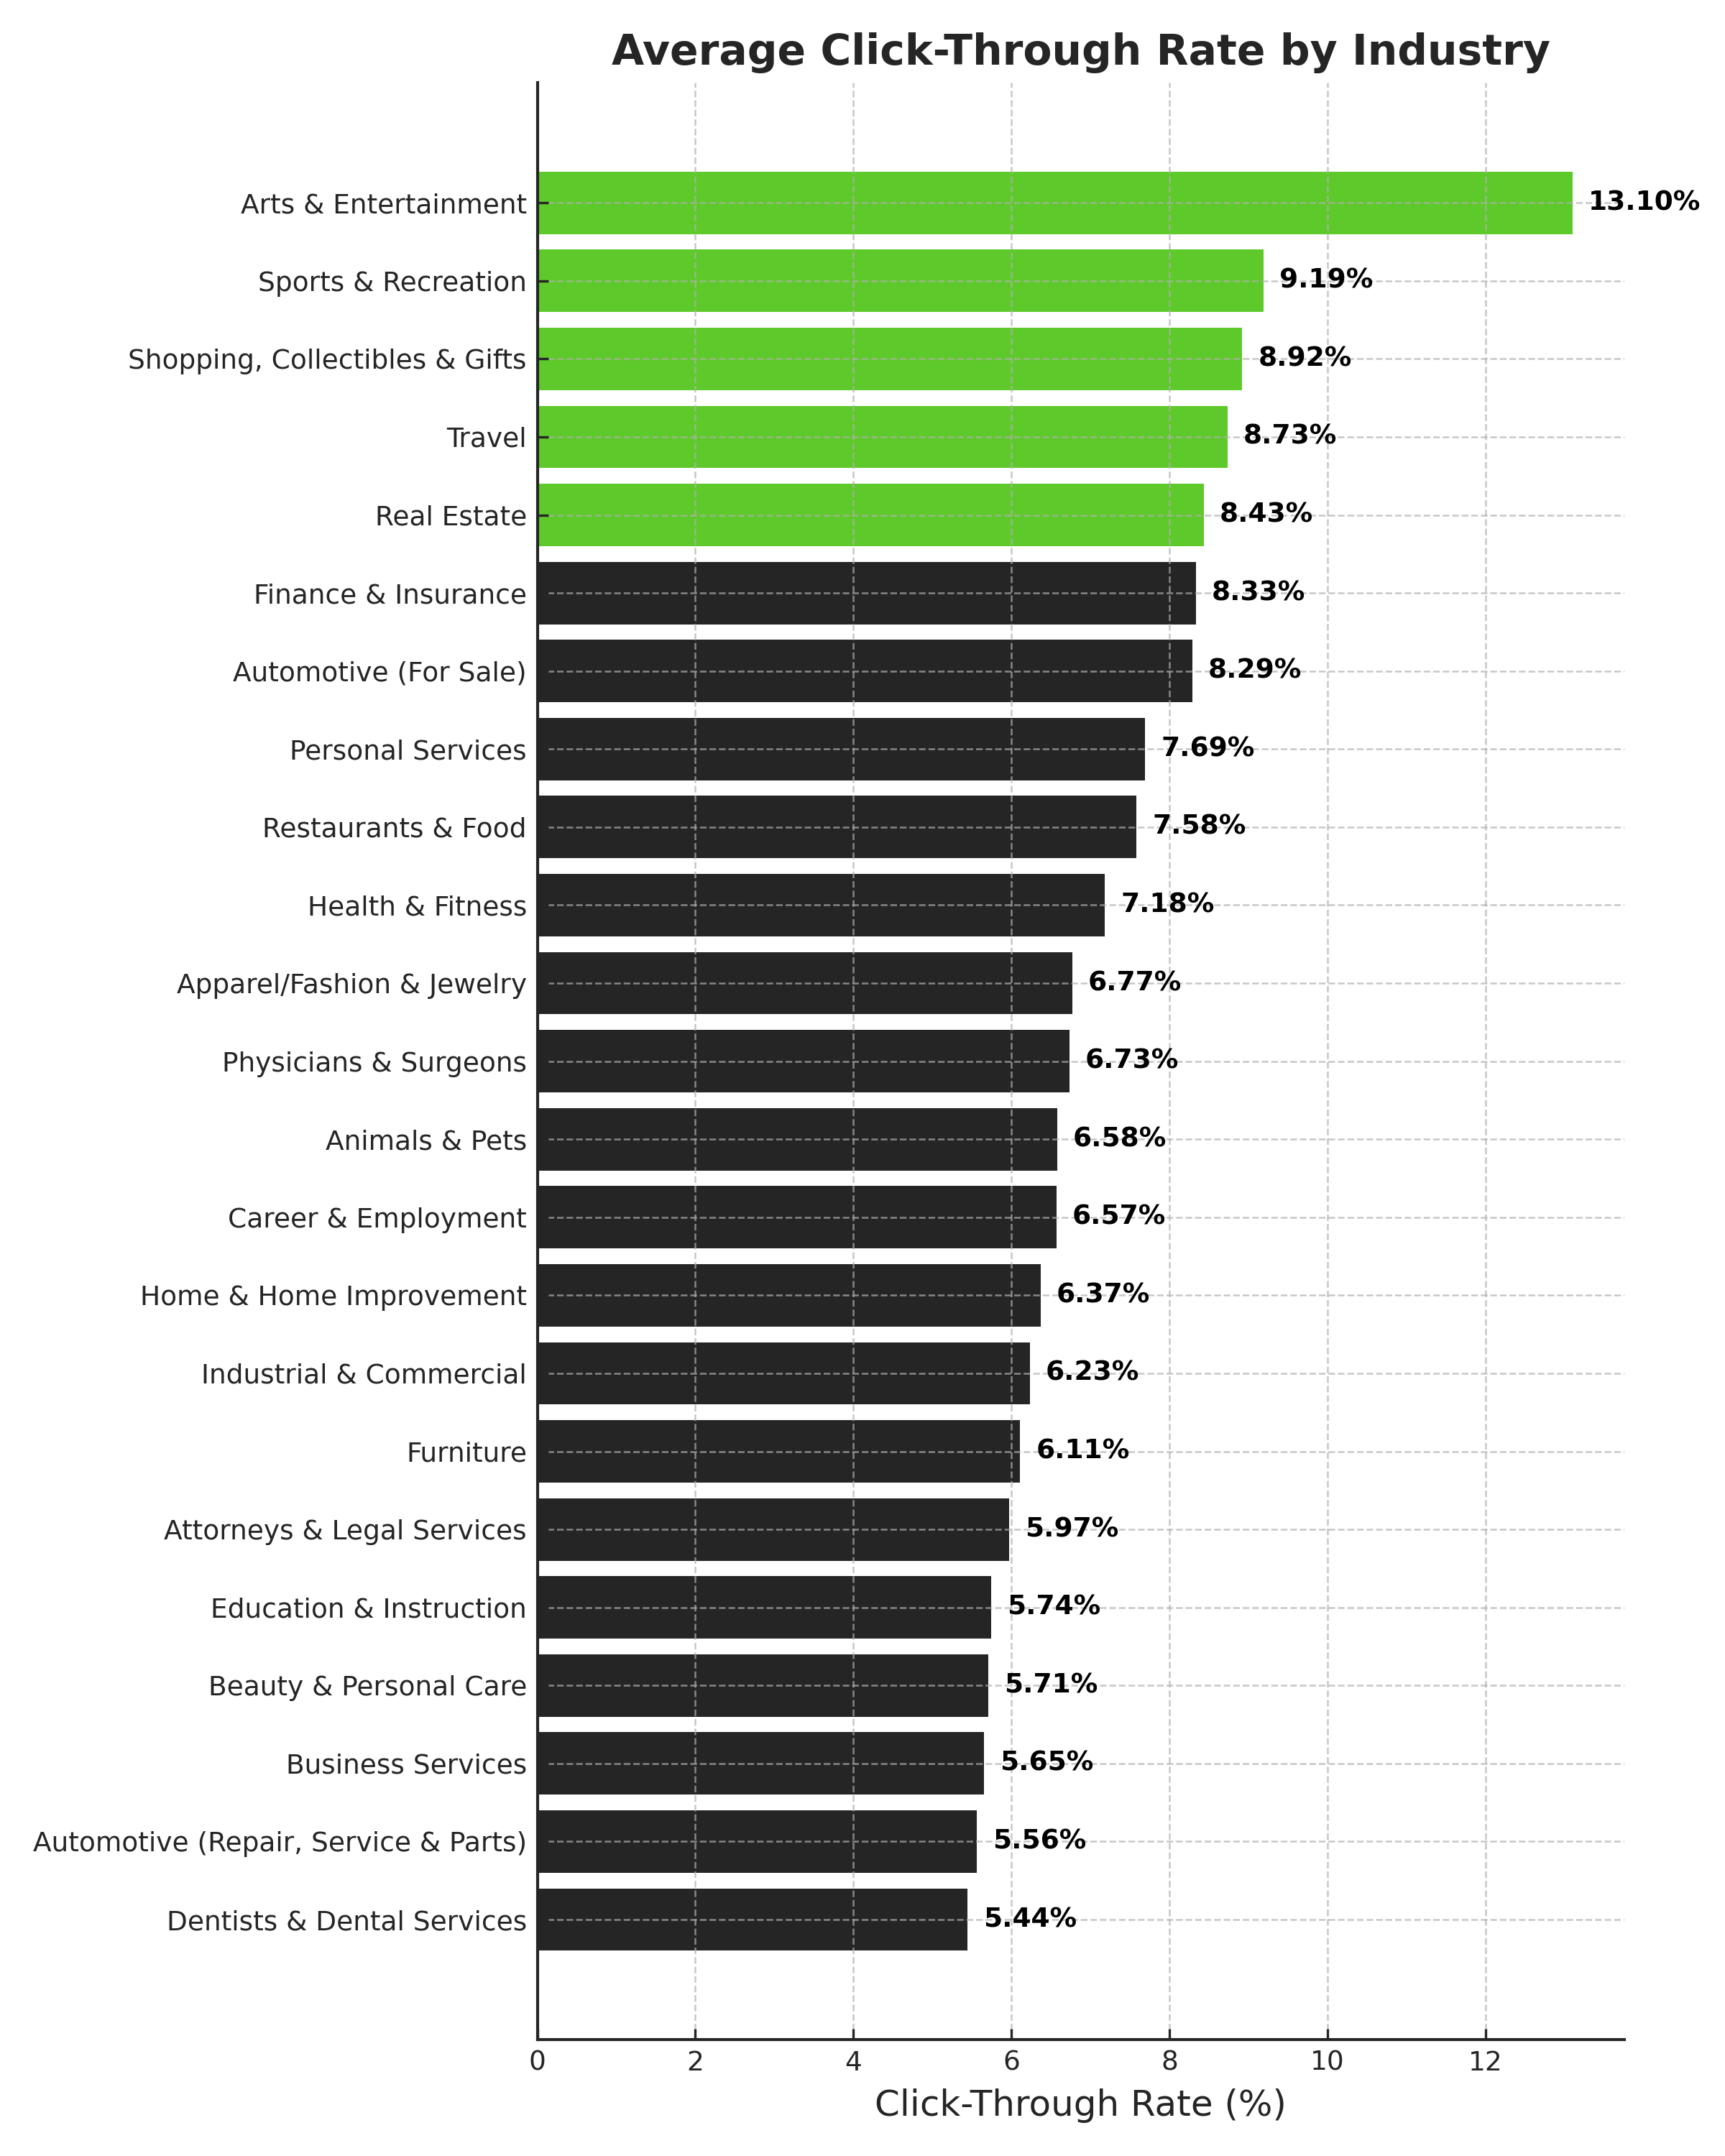
CTR depends on ad creative, keyword relevancy, and bid (among others, but usually these three).

Just looks at CTR without knowing how close the keywords are to the "core" 4-5 keywords of the industry means nothing. If you run on Max CPC and lower your bid, your CTR will drop because you'll lose position, not because your ad sucks ot keyword are not relevant.

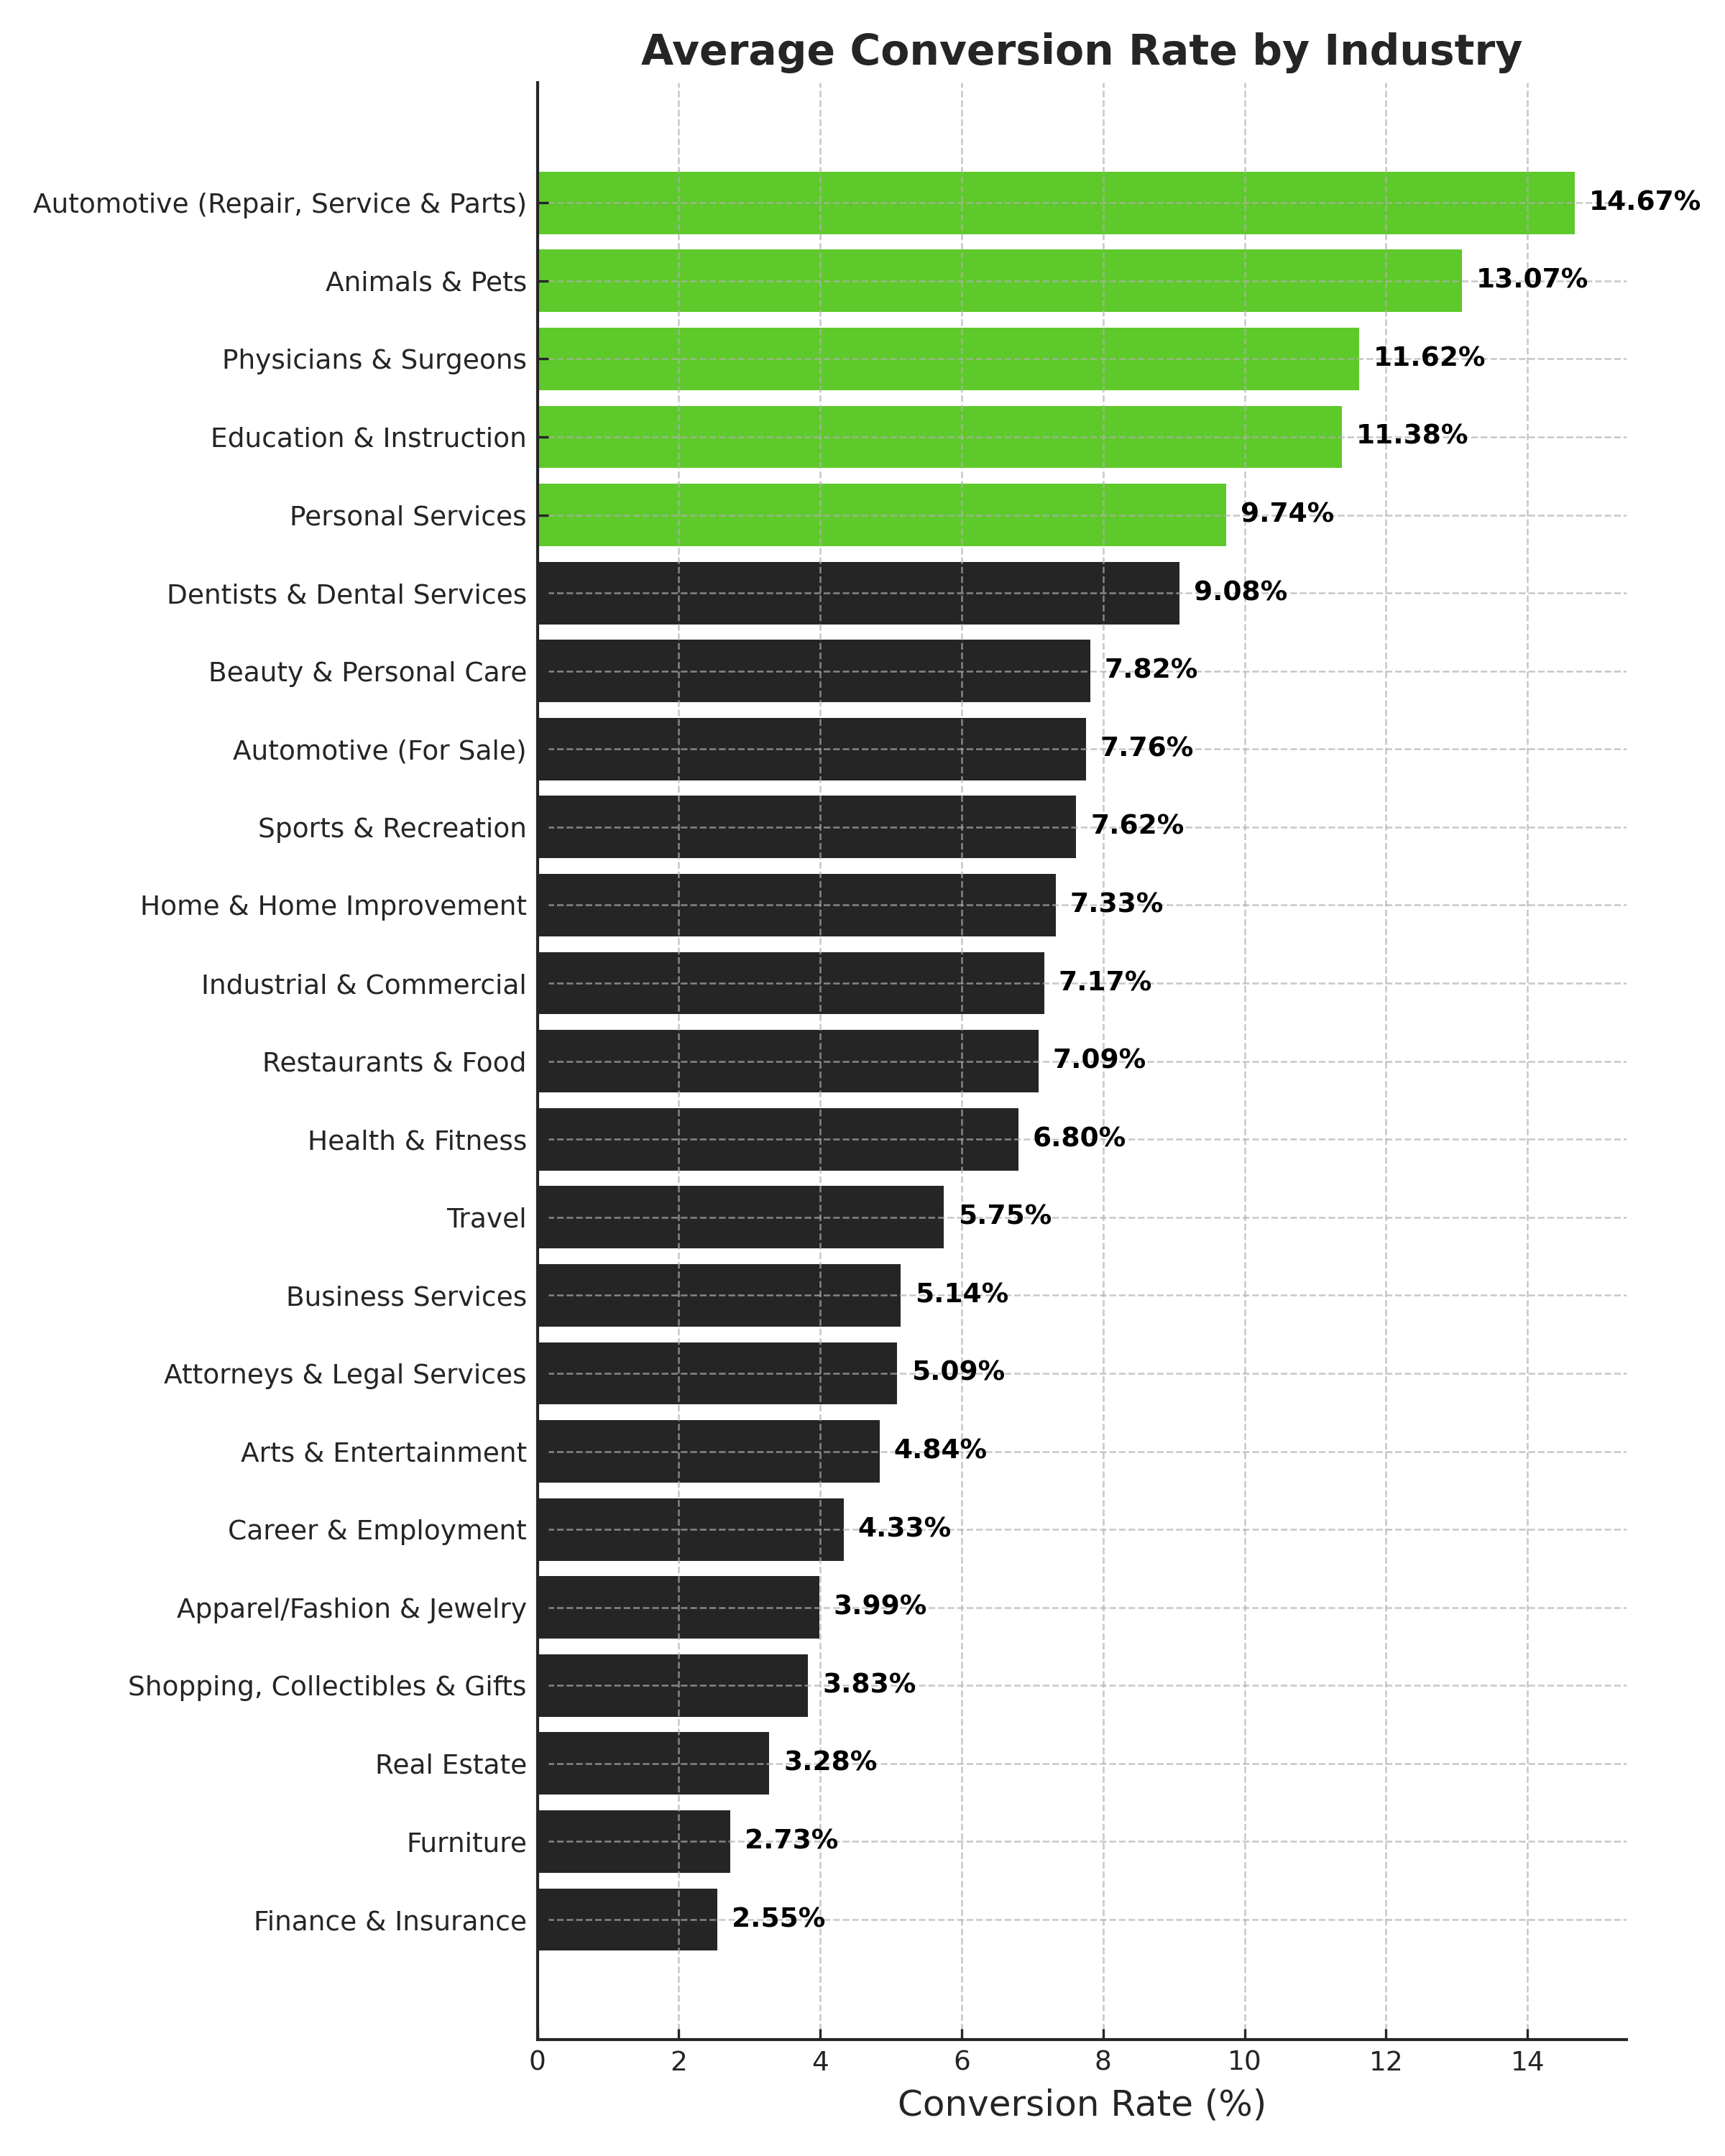
Conversion rate is highly manipulable(?) as well, because without the context of what counts as a conversion you can't possibly say what it means.
If I fire a conversion for scroll depth? I'll beat your 7% average with 50%.
But even if we both track the same event. Let's say it's leads.
You ask for a name and phone number, while I ask for zip code, phone, email, full name, car color and a favorite spice girl. You'll have a higher CvR, but my leads would be a lot better, probably resulting in more sales overall. Should you prioritize higher CvR over sales?

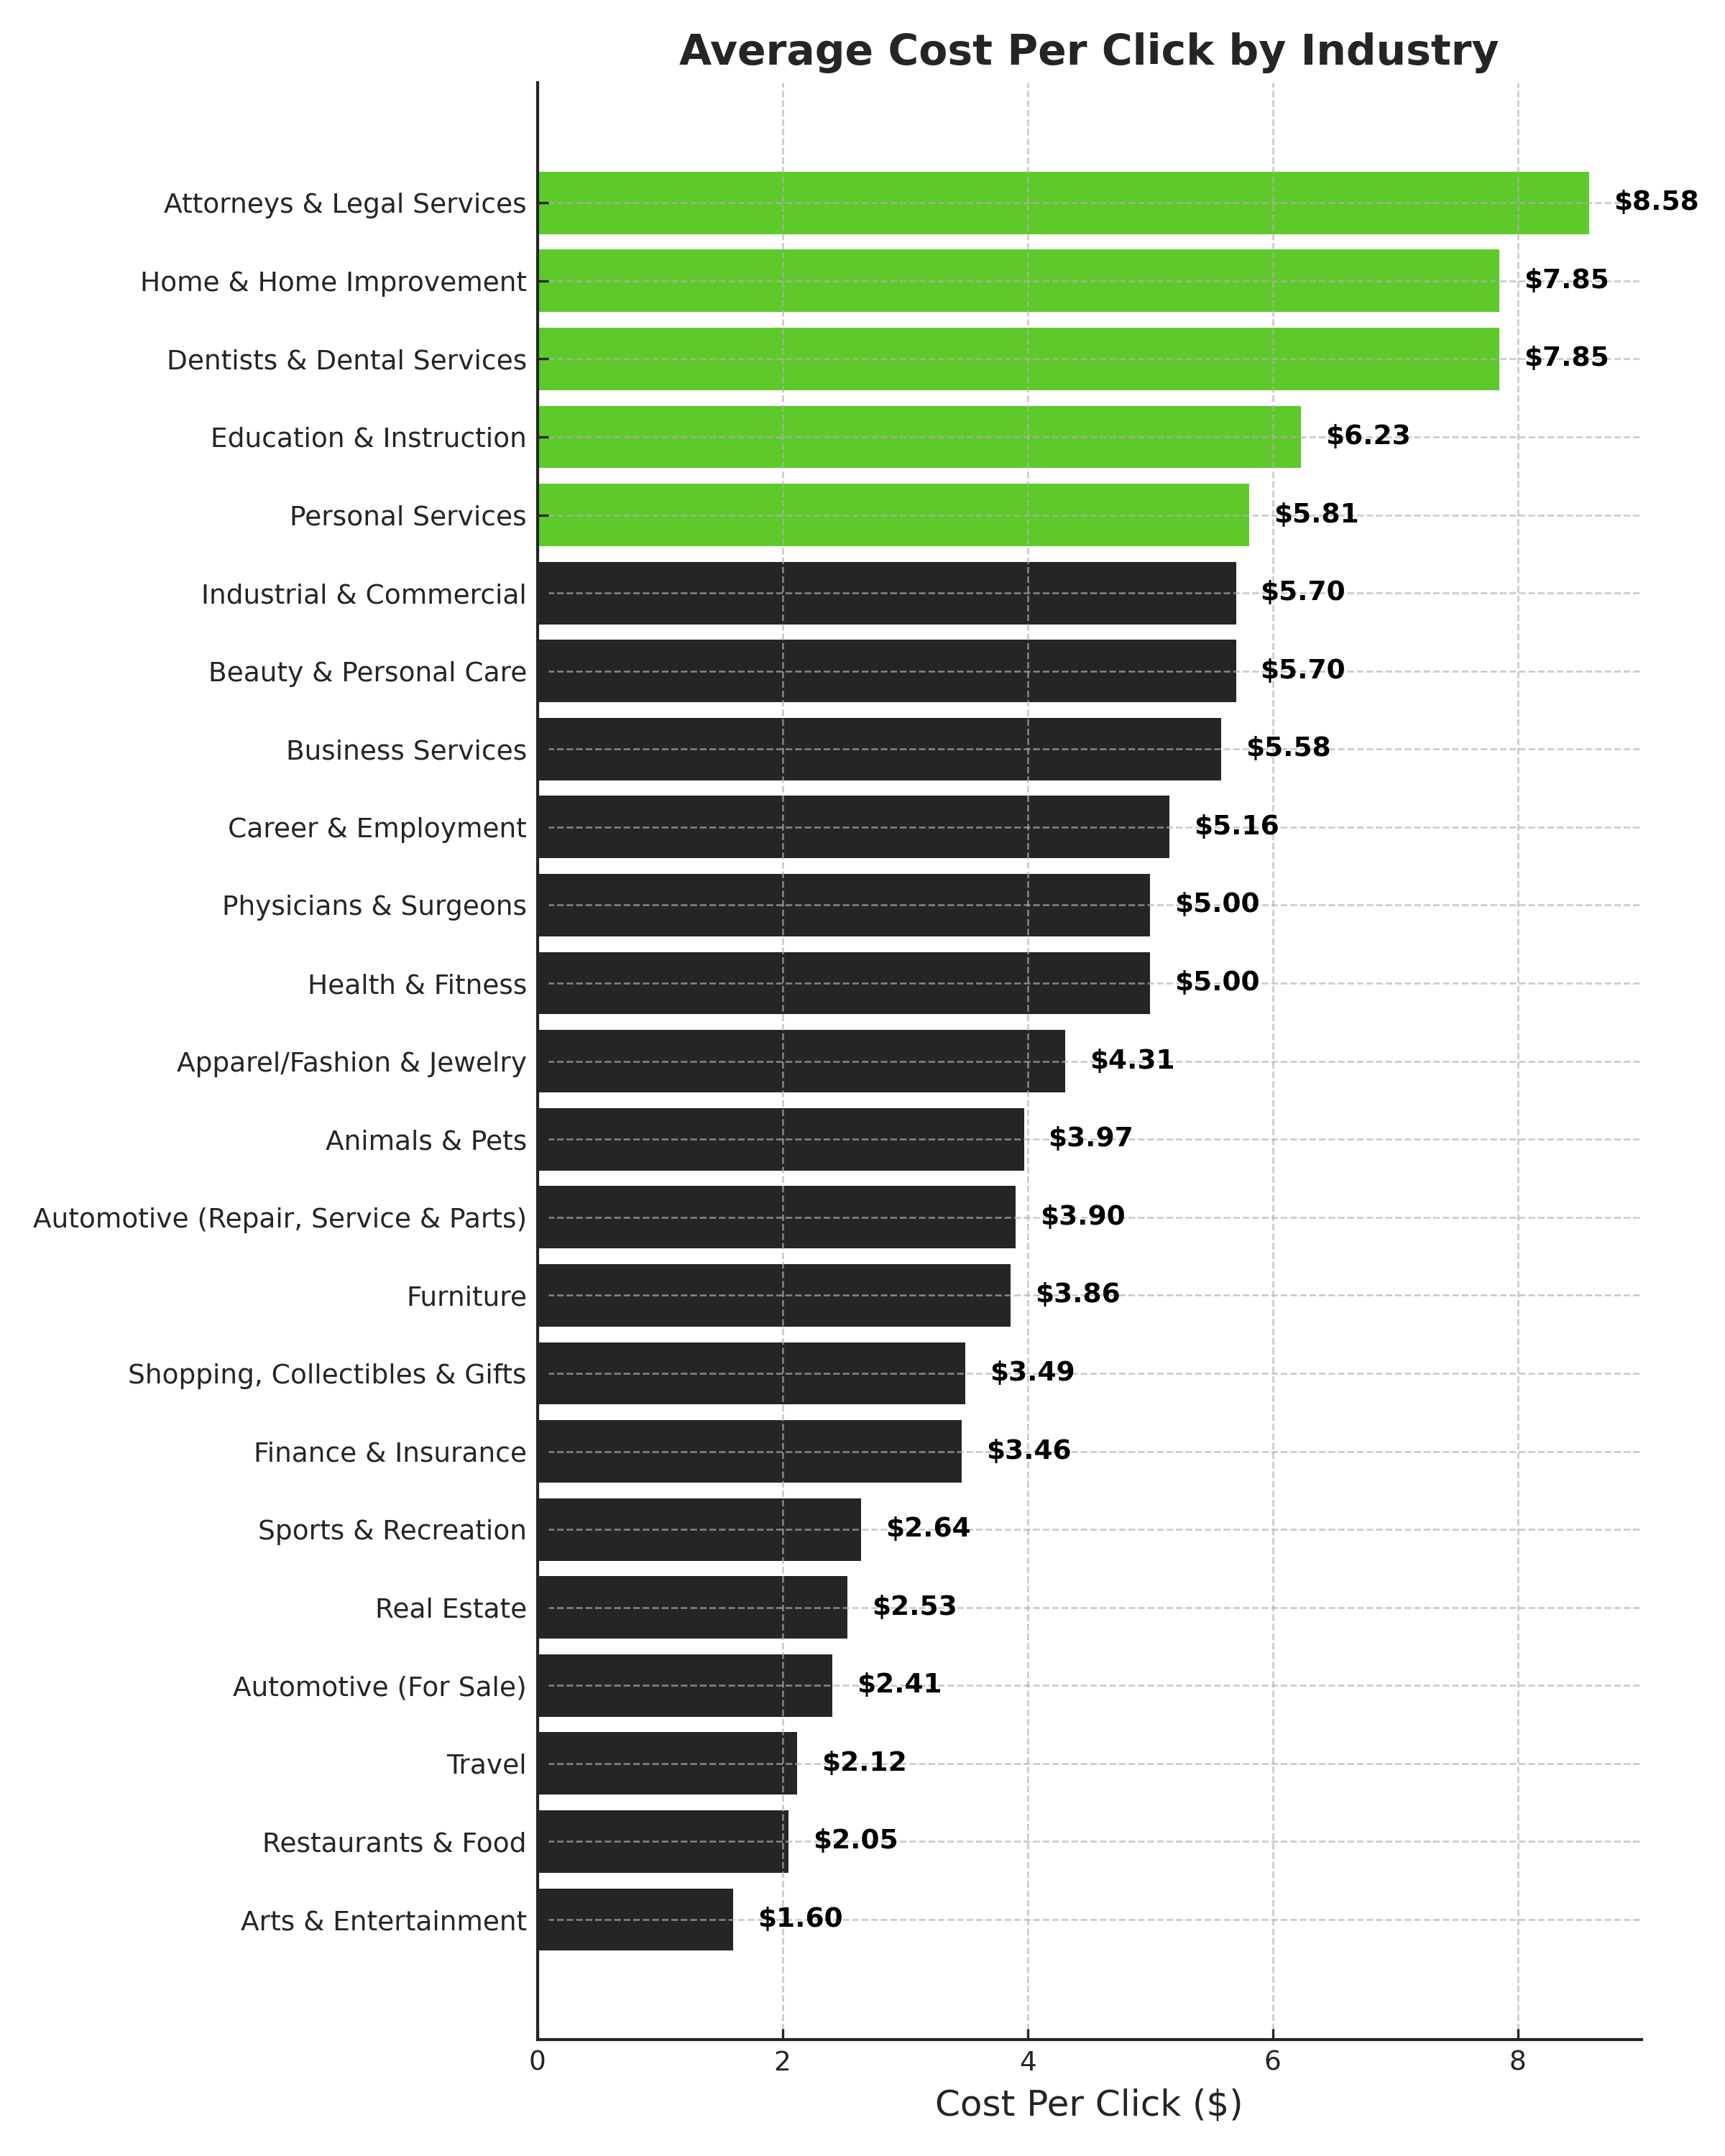
CPC is another bullshit metric to look at because in many automated bidding strategies it's linked to the budget. Either way it's directly linked to the traffic volume you're after and the event you're optimizing for.
Using automated bidding strategies (conversion oriented ones, at least) will work on improving your CvR while increasing CPC. So if you had a CvR of 5% with a CPC of $5, you'll likely increase both by moving to tCPA, so even if you bid for $100, you'll likely increase your CPC and CvR by the same amount (let's say $10 CPC and 10% CvR to hit the same $100 target)

I wrote a thread in which I explain this theory in a more well organize matter, if you're interested.
 
@roydan I more than understand what you're saying.

But you do understand the chart is based on average? You know what average is yes?


Your asking for specific information based on data sets. No one will give you that data. Hence why these charts are based on average information. It makes no difference where you are for CTR or what you are for the Conversion rate.


I understand your bug with these kinds of charts. I have similar gripes but for different reasons.
 
But you do understand the chart is based on average? You know what average is yes?
I know what average means, I just say that looking at broad averages makes this entire study unusable.

Your asking for specific information based on data sets. No one will give you that data. Hence why these charts are based on average information. It makes no difference where you are for CTR or what you are for the Conversion rate.
I don't expect anyone to provide specific data, I'm just ranting that a company that should know better publish such a stupid study, in which absolutely nothing is meaningful or usable.
 
Back
Top